
Multi-variant A/B testing at Telus Digital
As part of the analytics and insight team, I am exposed to exciting projects. One of the first projects when joining the team was to analyze a multivariate test that we were running on our homepage.
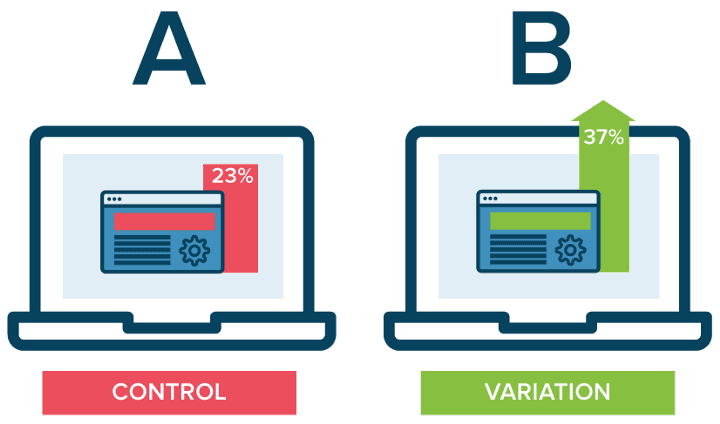
To provide a backstory before I talk about the process and technology, A/B testing or multivariate testing is the method of comparing two versions or more of a webpage or app against each other to determine which one performs better.
It is a great practice that can help improve a given experience or a single goal like conversion rate over time. As well, it can help enable data-informed decisions that shift conversations from “we think” to “we know”. It also helps to allow companies to become data-driven.
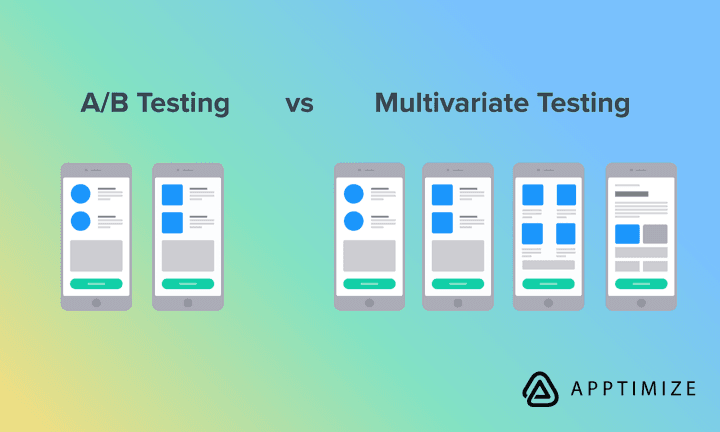
As part of the project we wanted to run an A/B test on our login page, however since it is a highly visited page, we could run a multivariate test instead.
Similar to an A/B test, a multivariate test allowed us to run 18 different variants alongside the control version. Our hypothesis was that copy aligned with our content standards and in line with our digital brand would drive click-through rates and conversations as opposed to our control counterpart.
We deployed the ambitious multi-variant test to production! Emotions and expectations were high. As one week passed, we were faced with a shocking, unexpected question.
When do we turn off the test?
On simple A/B tests you can start to see results rather quickly depending on your traffic, however since we had 18 variations we know we needed enough traffic to select a winner. We turned to simple statistics to help us with the answer.
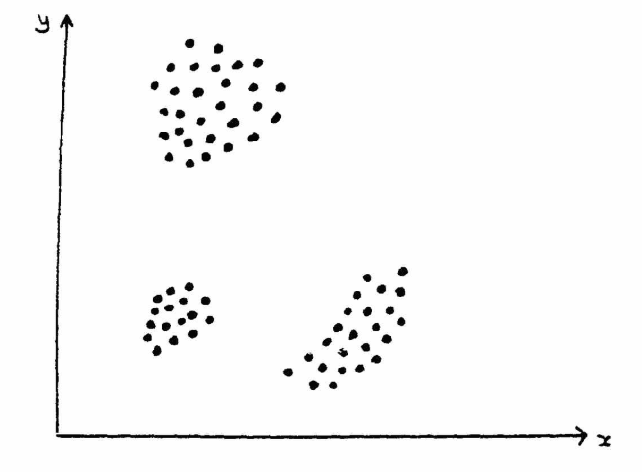
The problem we were faced is after one week of running the tests; there was no clear winner or loser, we need to run the tests longer. To visualize our tests, we plotted each test with its click-through rate, and we got a tight cluster. We measured the standard deviation of the group and we got 175.33.
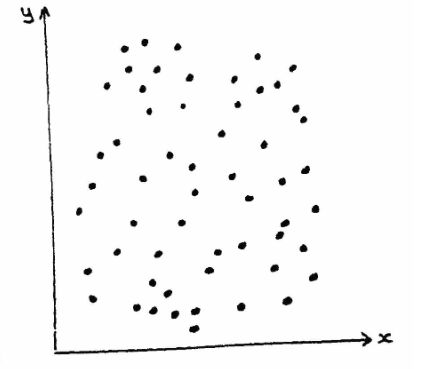
After the second week of running the tests, our standard deviation was 189.34. Our hypothesis was solid, the longer the tests ran, the large the standard deviation which meant a broader distribution of our cluster, a winner was likely to emerge.
Finally, we decided to turn off the tests after three weeks with a standard deviation of 215.85. We took at click-through rate and successful login registration as our metrics, and we added them to generate our final chart.
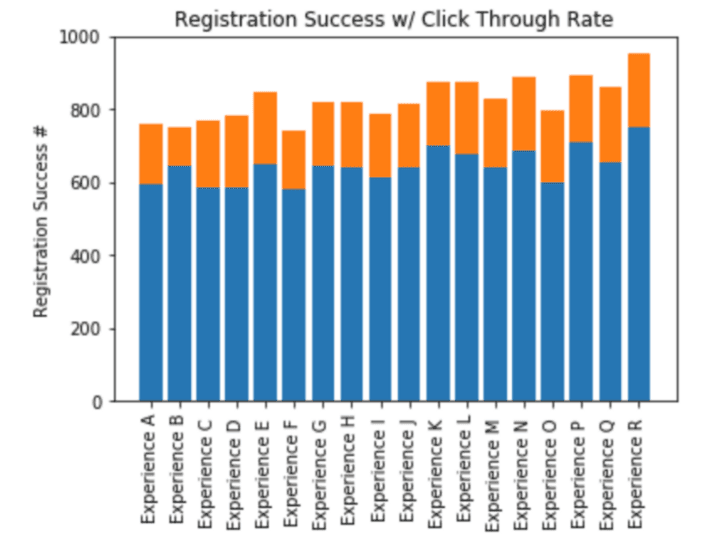
Our winner was Experience R!
It was a great experience and an excellent opportunity to use simple statistics to solve a problem.